ProxyStats is a third-party benchmark that probes residential proxy networks around the clock from EU and US infrastructure and publishes the results publicly. On 2 September 2026 it ranked this network first of the twelve providers it tracks, at a composite score of 94.8/100. We didn't pay for the placement and we don't run the tests — so it's worth explaining exactly what was measured, where our numbers came out, and the limits of any benchmark like this one.
What ProxyStats measures
ProxyStats runs an automated harness against a live account on each network it lists. Probes fire from two vantage points — European and US infrastructure — and score five things: connection latency, request success rate, IP quality (how much of the pool reads as genuinely residential rather than flagged or datacenter), geo-accuracy against the country that was requested, and throughput. Those roll up into a single composite out of 100, refreshed every 24 hours, with the per-use-case leaderboards re-tested every 6 hours.
The volume is what makes it interesting: across all twelve tracked providers the platform reported 997,909 tests in the trailing 30 days, of which 48,537 ran against this network. That is a far larger sample than any hand-run comparison, and unlike a review post it keeps running after publication — a provider that quietly degrades shows up in the numbers within a day.
Listings are free and not pay-for-placement, and any provider can ask to be removed. That cuts both ways: it's why the ranking is worth citing, and also why nobody — us included — controls what it says next week.
The leaderboard on 2 September 2026
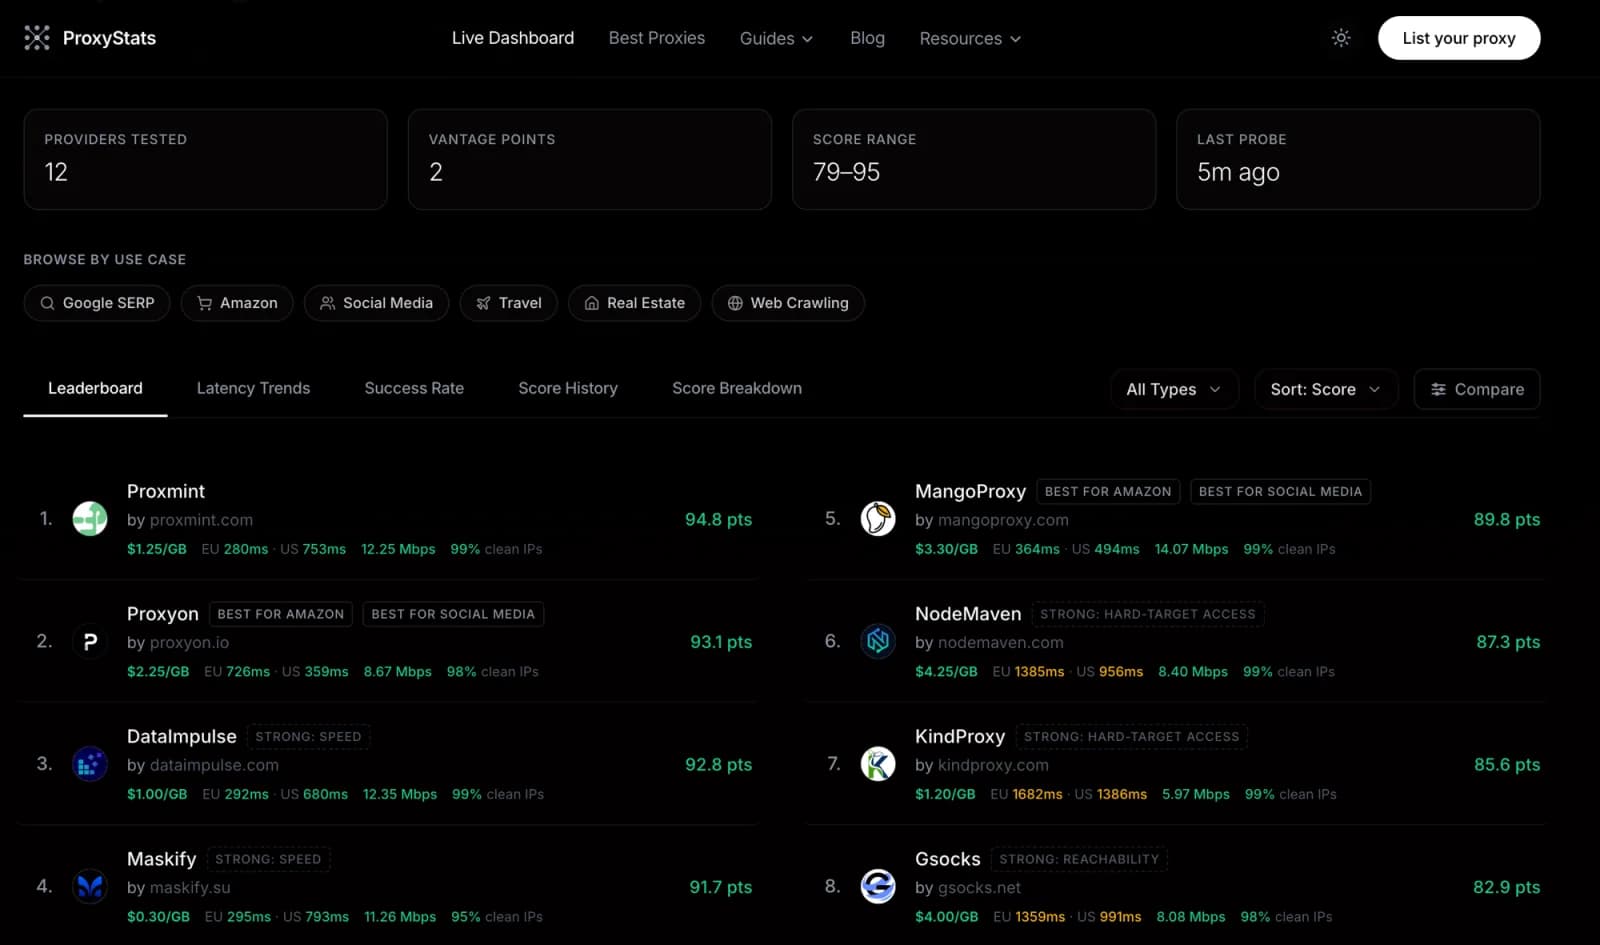
Here is the top of the table as published, with each provider's advertised entry price alongside the measured figures. Latency is the median round trip from each vantage point; clean IPs is the share of sampled exits that passed their reputation check.
| Provider | Composite | Price/GB | EU / US latency | Clean IPs |
|---|---|---|---|---|
| 1. Proxmint | 94.8 | $1.25 | 280ms / 753ms | 99% |
| 2. Proxyon | 93.1 | $2.25 | 726ms / 359ms | 98% |
| 3. DataImpulse | 92.8 | $1.00 | 292ms / 680ms | 99% |
| 4. Maskify | 91.7 | $0.30 | 295ms / 793ms | 95% |
| 5. MangoProxy | 89.8 | $3.30 | 364ms / 494ms | 99% |
| 6. NodeMaven | 87.3 | $4.25 | 1385ms / 956ms | 99% |
| 7. KindProxy | 85.6 | $1.20 | 1682ms / 1386ms | 99% |
| 8. Gsocks | 82.9 | $4.00 | 1359ms / 991ms | 98% |
The 30-day numbers behind the score
A single day's composite is a snapshot; the trailing 30-day aggregate is the more honest figure, and it is lower. Over that window ProxyStats recorded 97.4% uptime, a 97.3% success rate on its scraping simulation, and a 564ms median response time across both vantage points, for a 30-day composite of 91.0/100.
That gap between 94.8 today and 91.0 over the month is not a contradiction — it's what a network under continuous measurement looks like. Good days and bad days both land in the average, and the average is the number to plan capacity against.
The latency split is the most useful detail in the table for anyone choosing a pool. Our EU median (280ms) is among the fastest measured; the US median (753ms) is mid-pack. If your targets are European, that ordering matters more than the composite does. If they're US-only, a provider further down the leaderboard may serve you better — which is the point of reading the columns instead of just the rank.
A note on the $1.25/GB in that table
Benchmarks quote one price per provider, and the one shown for us is the floor rather than the entry rate. Residential bandwidth starts at $1.80/GB on small packs and decays with volume down to $1.25/GB from 100 GB up, which is where the listed figure comes from. If you arrive from that leaderboard expecting $1.25 on a 5 GB pack, you'll see $1.80 — so we'd rather state it here than have you find it at checkout.
The same caveat applies to every row in the table. Advertised per-GB rates are almost always the deepest tier, and they rarely include whatever minimum spend or expiry the provider attaches. Bandwidth here doesn't expire, which changes the real cost of a small pack more than the headline rate does.
What a benchmark can't tell you
Two vantage points are two vantage points. A network measured from Frankfurt and Virginia says very little about how it behaves from São Paulo or Singapore, and nothing at all about the specific site you need to reach. Ranking positions also move: composites cluster within a few points of each other, so a couple of unlucky probe windows can swap several places on the table without anything real having changed underneath.
Automated harnesses have their own failure modes, too. Probe fleets change size, detectors get retuned, and a failed request can be misfiled as a different kind of failure — the sort of thing that shows up as a sudden score movement with no matching change on the provider's side. Treat any single day's leaderboard as one input, not a verdict.
Most importantly, a benchmark tests a generic workload. Yours is not generic. The only test that settles it is your own scraper, on your own targets, from your own infrastructure — which is why we sell bandwidth that doesn't expire and why the sensible way to evaluate any provider on that list is to buy the smallest pack and run your real job through it.
What we take from it
Third-party measurement is worth more to a buyer than anything we can say about ourselves, so we're glad the numbers are public and we'd rather they stayed public on the days they're less flattering. The results that matter to us are the boring ones: clean-IP share at 99%, success rate near 97%, and EU latency at the front of the field.
The rest is your call to verify. The live leaderboard is linked below, the pool is the same one the benchmark tested, and country targeting is included on every plan — so the comparison you actually care about is a few minutes and a small pack away.